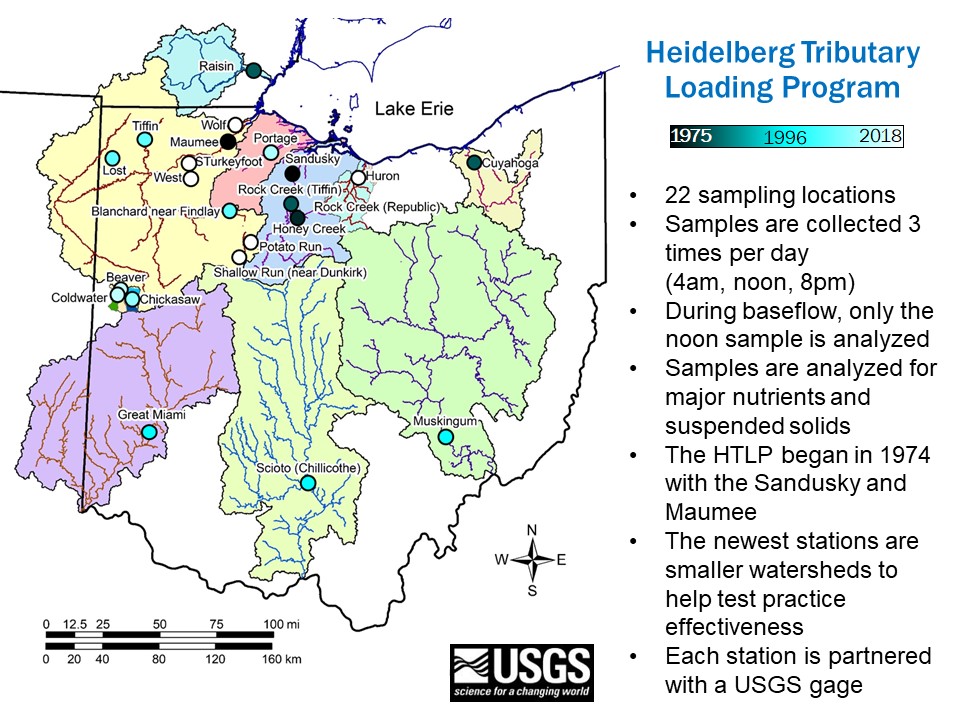
The Heidelberg Tributary Loading Program
Overview
HTLP Data Portal
Data Portal User Guide
FAQs
Cite the data as: NCWQR. 2022. Heidelberg Tributary Loading Program (HTLP) Dataset. Zenodo. https://doi.org/10.5281/zenodo.6606949
Other Useful Information:
Spreadsheet of Sampling Station Metadata
2022 Ohio EPA Project Study Plan and Quality Assurance Plan
Miscellaneous Tutorials
a. Hydrographs, Sedigraphs and Chemographs
b. Loading Calculations, Annual Loads and Unit Area Loads
c. Concentration Exceedancy Curves
d. Time-weighted and Flow-weighted Mean Concentrations
e. Concentration-Flow Relationships
g. Relationships between Pollutant Loading and Stream Discharge
Data quality control and data screening
The data provided on the data portal have all been screened by NCWQR staff. The purpose of the screening is to remove outliers that staff deem likely to reflect sampling or analytical errors rather than outliers that reflect the real variability in stream chemistry. Often, in the screening process, the causes of the outlier values can be determined and appropriate corrective actions taken. These may involve correction of sample concentrations or deletion of those data points.
This data portal contains data for over 150,000 water samples collected beginning in 1974. We cannot guarantee that each data point is free from sampling bias/error, analytical errors, or transcription errors. However, since its beginnings, the NCWQR has operated a substantial internal quality control program and has participated in numerous external quality control reviews and sample exchange programs. These programs have consistently demonstrated that data produced by the NCWQR is of high quality.
A note on detection limits and zero and negative concentrations
It is routine practice in analytical chemistry to determine method detection limits and/or limits of quantitation, below which analytical results are considered less reliable or unreliable. This is something that we also do as part of our standard procedures. Many laboratories, especially those associated with agencies such as the U.S. EPA, do not report individual values that are less than the detection limit, even if the analytical equipment returns such values. This is in part because as individual measurements they may not be considered valid under litigation.
The measured concentration consists of the true but unknown concentration plus random instrument error, which is usually small compared to the range of expected environmental values. In a sample for which the true concentration is very small, perhaps even essentially zero, it is possible to obtain an analytical result of 0 or even a small negative concentration. Results of this sort are often “censored” and replaced with the statement “<DL” or “<2”, where DL is the detection limit, in this case 2. Some agencies now follow the unfortunate convention of writing “-2” rather than “<2”.
Censoring these low values creates a number of problems for data analysis. How do you take an average? If you leave out these numbers, you get a biased result because you did not toss out any other (higher) values. Even if you replace negative concentrations with 0, a bias ensues, because you’ve chopped off some portion of the lower end of the distribution of random instrument error.
For these reasons, we do not censor our data. Values of -9 and -1 are used as missing value codes, but all other negative and zero concentrations are actual, valid results. Negative concentrations make no physical sense, but they make analytical and statistical sense. Users should be aware of this, and if necessary make their own decisions about how to use these values. Particularly if log transformations are to be used, some decision on the part of the user will be required.
